
Read your Insights reports
Seven reports listed under Insights in the sidebar, new-number dots, sortable tables, period and location filters, and Create report.
Insights turns every menu open, dish tap and AI waiter chat into numbers you can act on. It is one page with seven reports, and each report is a row under Insights in the sidebar.
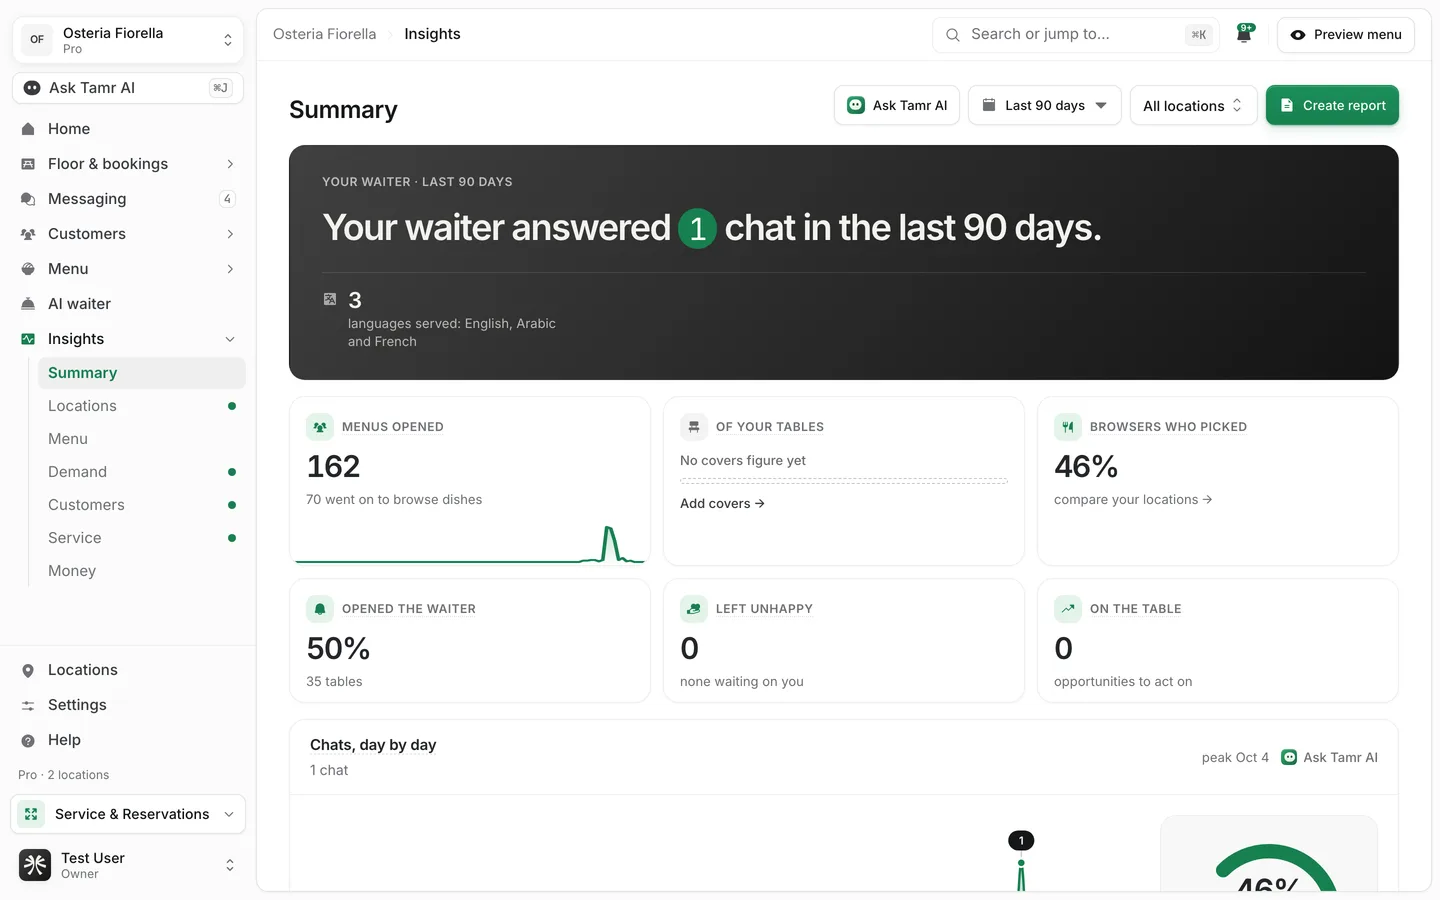
On Free, the Summary report is open and shows your counts. Every other report opens to a locked preview with sample numbers and a Get Pro button. See what Free sees →.
The reports
Open Insights in the sidebar to list the reports, then pick one. The period and location you set stay in place when you switch between them.
SummaryfreeLocationspro · 2+ locationsMenuproDemandproCustomersproServiceproMoneypro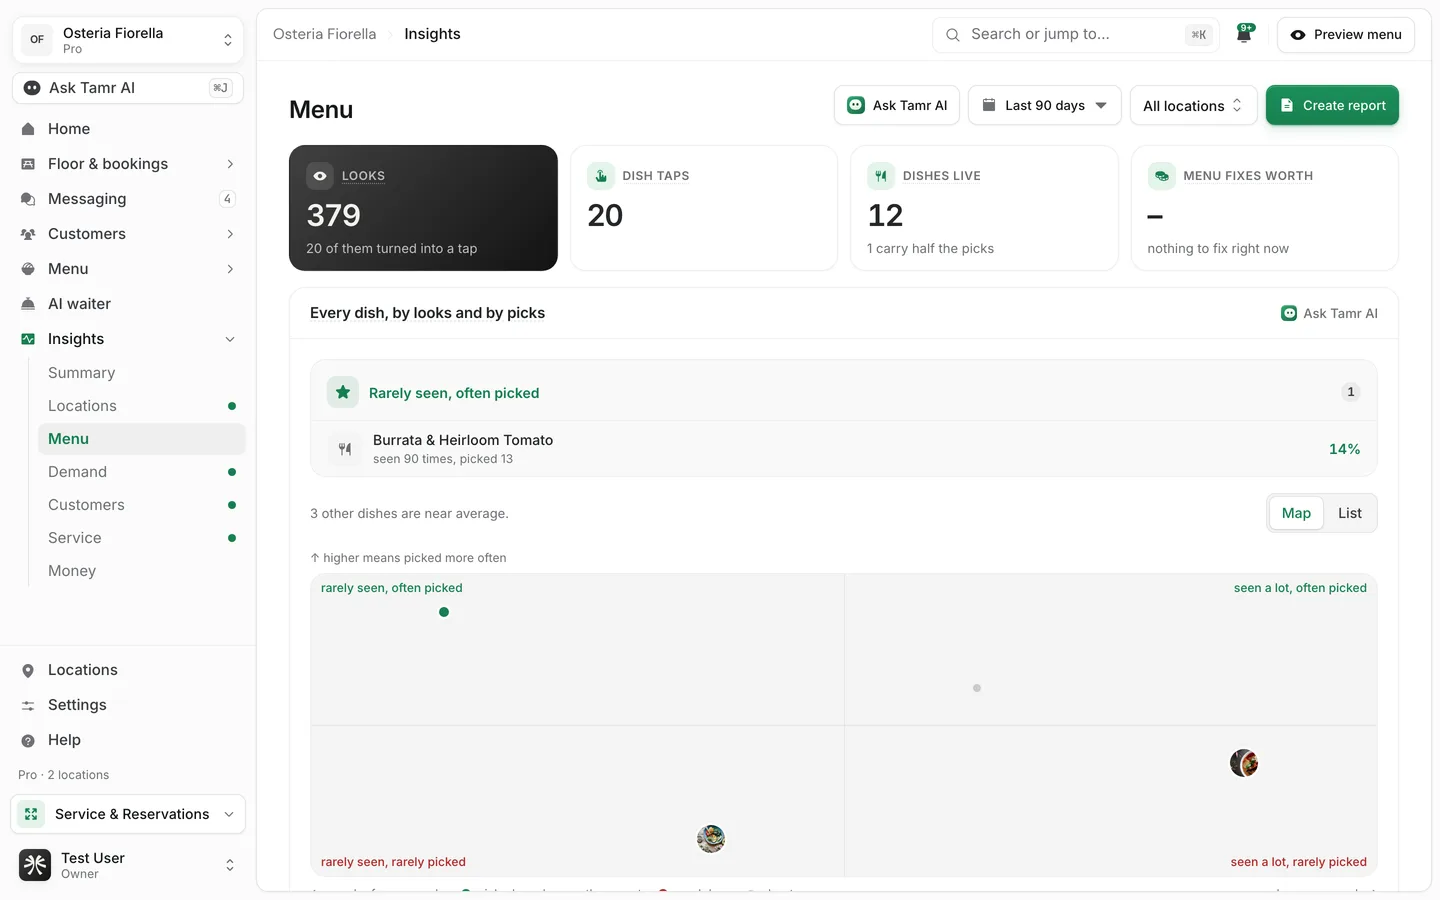
Set the period and location
Every report shares the same controls at the top right.
- 1Pick a period
Open the date menu and choose Today Yesterday Last 7 days Last 30 days Last 90 days or Custom range. The default is Last 7 days. Trends compare against the period of the same length before it.
- 2Pick a location
Use the location menu to see All locations or one location. It only appears when you have more than one location.
- 3Ask about what you see
Select Ask Tamr AI in the header, or the Ask Tamr AI link on any panel, to ask a question about the numbers on screen. See Ask Tamr AI →.
Spot new numbers
A green dot next to Insights in the sidebar means customers have talked to the AI waiter since you last opened one of the reports. Open the list and each report with new numbers carries its own dot. Opening a report clears its dot.
The dots are per person: your colleagues have their own. They refresh every 10 minutes.
Sort a table
Where a report shows a table, select a column heading to sort by it, and select it again to reverse the order. In the Locations report you can sort by Menu opens, Of its tables, Picked a dish, Asked the AI waiter and Unhappy.
Most figures have a dotted underline. Hover or tap it to read exactly what is counted, for example that Menus opened counts phones, not taps.
Create a report
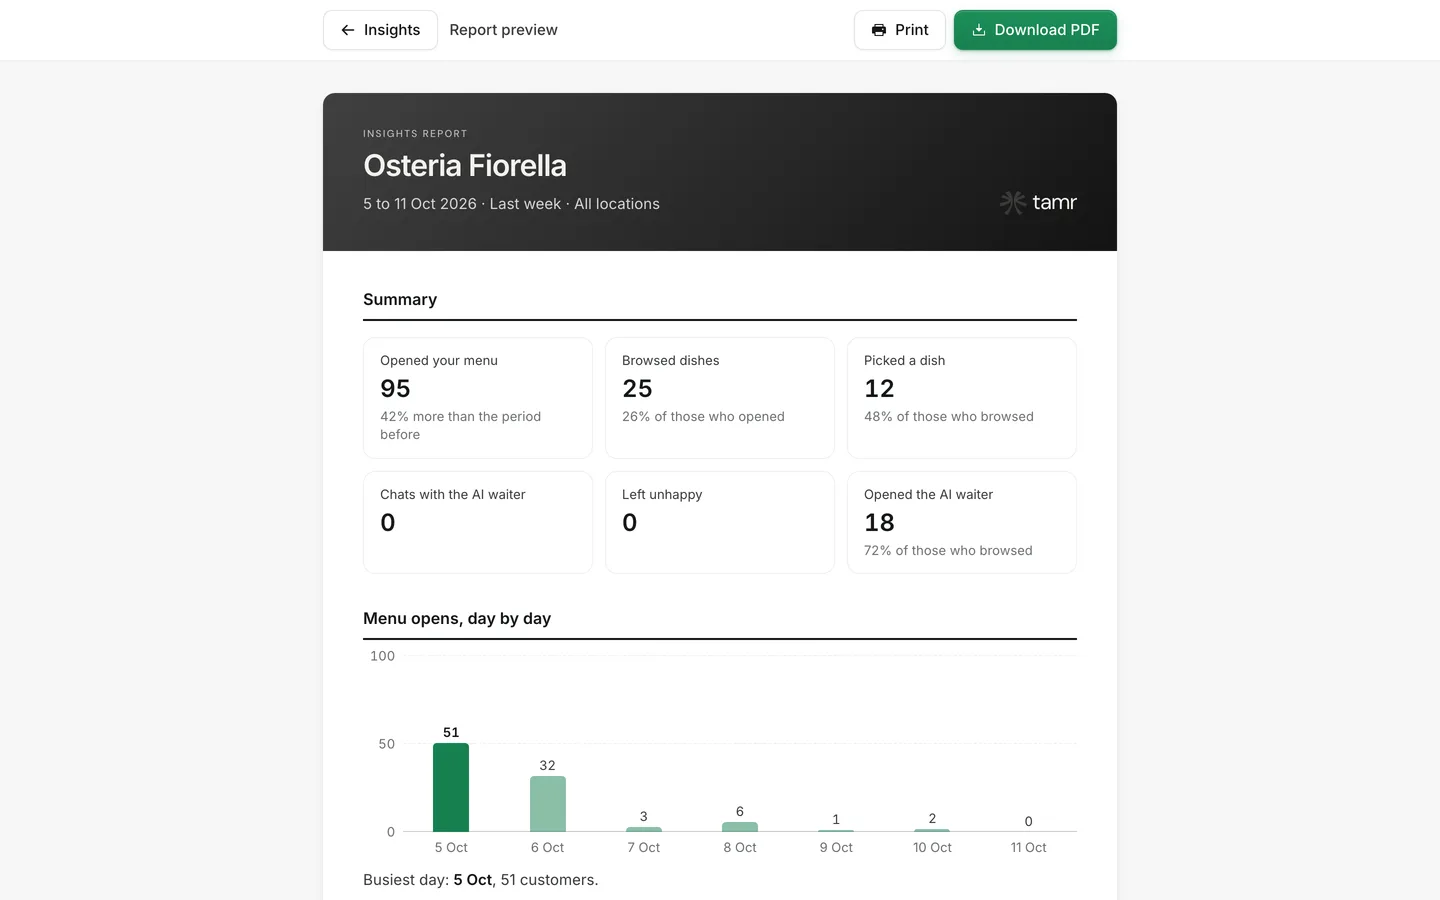
Create report builds a print-ready A4 report of your numbers for a chosen period, to share with a partner or keep on file.
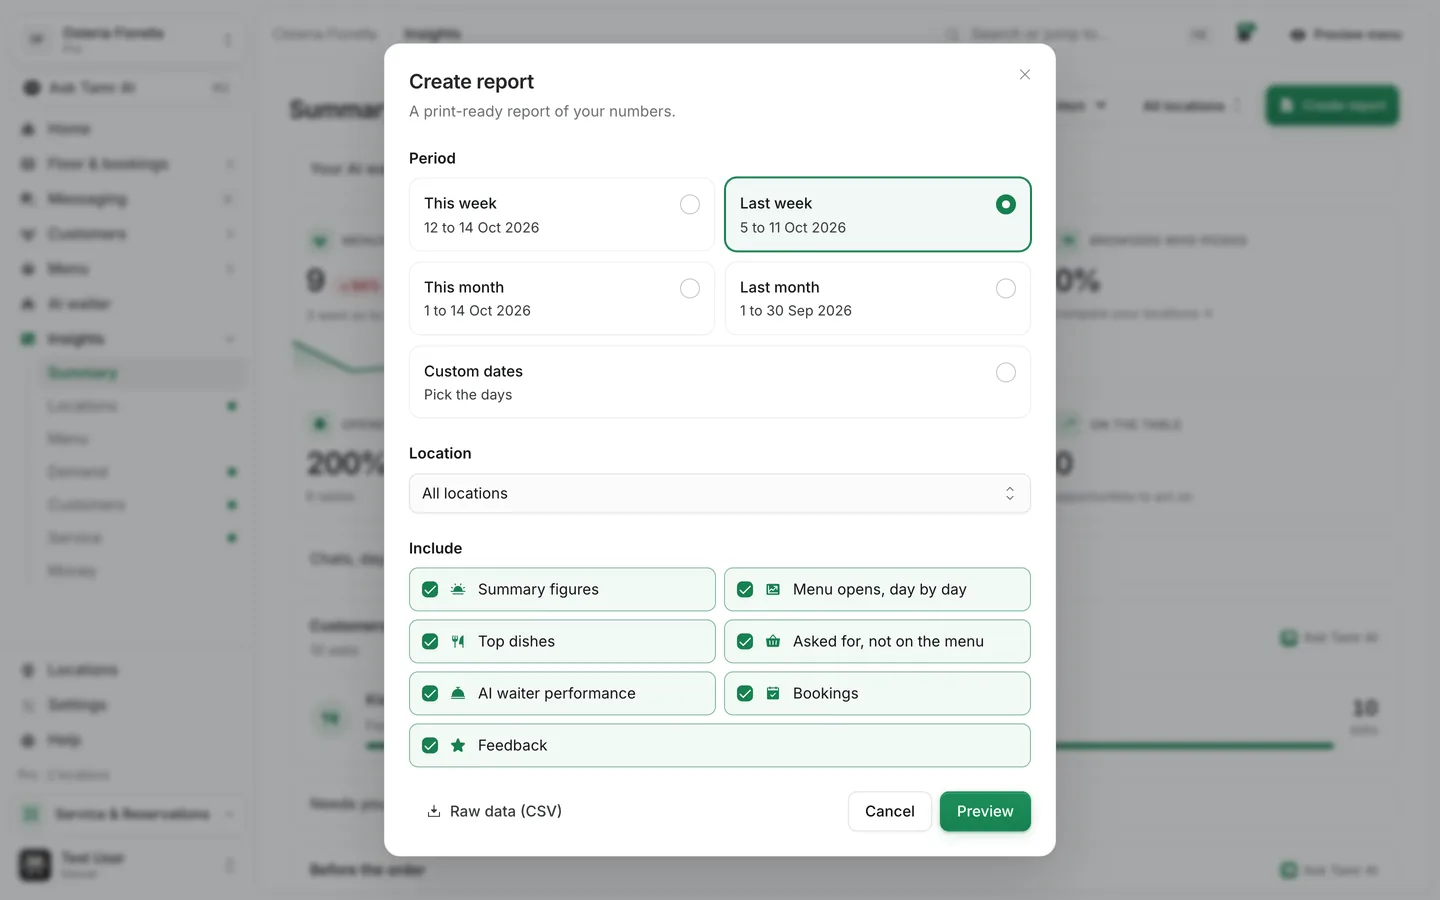
- 1Open Create report
On any Insights report, select Create report.
- 2Choose the period
Pick This week, Last week, This month, Last month or Custom dates. Weeks run Monday to Sunday; this week and this month stop at today.
- 3Choose the location and sections
If you have more than one location, pick All locations or one. Under Include, tick the sections you want: Summary figures, Menu opens, day by day, Top dishes, Asked for, not on the menu, AI waiter performance, Bookings and Feedback.
- 4Preview, then print or save
Select Preview to open the report as an A4 page. Select Print, or Download PDF and choose Save as PDF in the print window.
Raw data (CSV) in the same dialog downloads the underlying numbers as a spreadsheet file on Pro. Very large exports are capped, and tamr tells you when that happens.
What Free sees
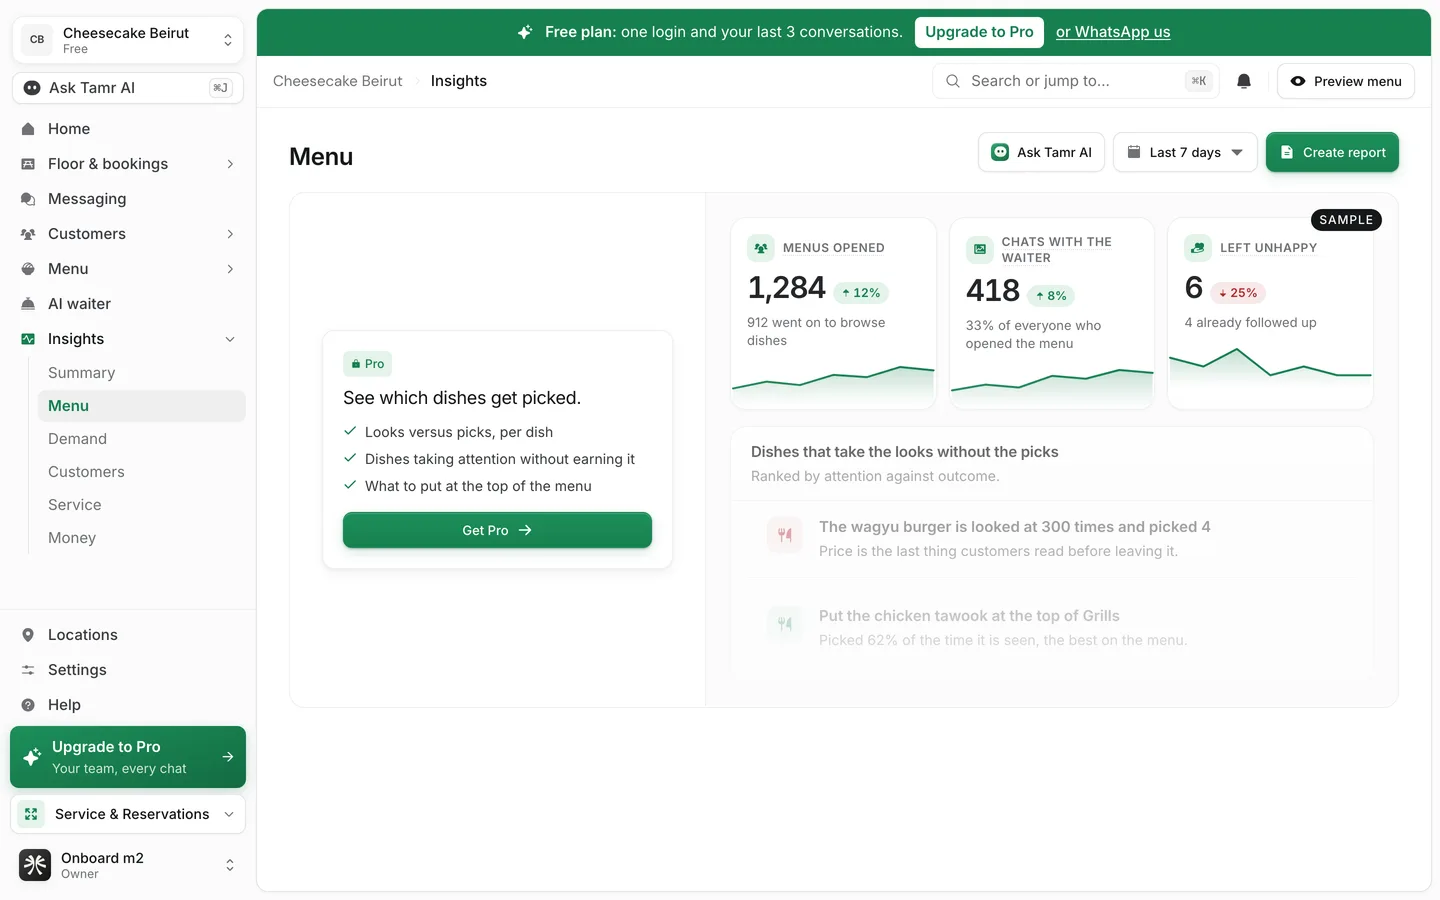
On Free, the Summary report stays open with its counts. The other reports open to a locked preview: the Pro card on the left lists what the report shows, and a labelled Sample on the right shows what it looks like. Select Get Pro to ask for Pro. See plans and billing →.
In Create report, Top dishes is marked Pro and cannot be ticked on Free, and Raw data (CSV) is not offered.
FAQ
Why don't I see a Locations report or a location menu?
Both only appear when your restaurant has more than one location customers can reach.
Why is a report empty?
Reports fill as customers open your menu and talk to the AI waiter. Try a longer period, such as Last 90 days, if your menu went live recently.
Do Today and Yesterday stay fixed if I bookmark them?
No. They are worked out again on each load, so a bookmarked link always shows the current day.
Are the dish numbers orders?
No. tamr sees what customers look at, tap and save on the menu, not your till. A pick means a customer chose the dish on the menu.
Where do I read the conversations themselves?
In Messaging. See Messaging →.
Related
Last reviewed October 14, 2026